When writing custom activities for WF4, you can cut some performance costs by overriding the CacheMetadata method. By default, CacheMetadata will use reflection to determine what properties are available as in/out arguments and setup their binding. Reflection can have a significant cost, as I’ll show in this post.
The example below is not something you’d typically see when designing a workflow. It is an extreme case meant to stress CacheMetadata. We’ll start with the custom activity itself.
|
|
This activity has four InArguments and one OutArgument and does some trivial work in the Execute method.
The following test program creates a workflow with 30,000 CodeActivity1 activities in it.
|
|
Notice that in this code I create the workflow first and then pause for the ReadLine. There are two reasons for this. The first is that CacheMetadata does not happen when the workflow type is instantianted. The second is that 30,000 activities takes up a bit of memory and there will be some GC collection going on. Pausing for user input helps to keep GC from skewing the results of the test.
Running this in release mode on my laptop, I get a time of 3.026 seconds.
So let’s now change the code to override the CacheMetadata method. I’ll also use a #define so I can turn this on and off quickly.
|
|
Running this code, I get a new time of 2.087 seconds. 33% is a substantial performance gain!
To understand this better, it helps to take before and after profiles. This can be done with Visual Studio 2010 Ultimate. We’ll start with the baseline by commenting out the #define in the code above. Then, go to the performance explorer and click the “New Performance Session” button (circled below).
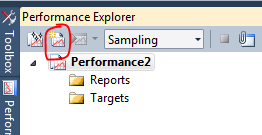
By default, the dropdown next to the button indicates “Sampling” profiling. This is what we want to use so correct it if this is not set. The next step is to make sure the configuration is set to “Release” mode and hit Ctrl+F5 to start the application. The application will stop at the ReadLine. At this point, we can attach our profiler by hitting the “Attach/Detach” button. Sometimes this button is hidden so you can right-click on the performance session instead.
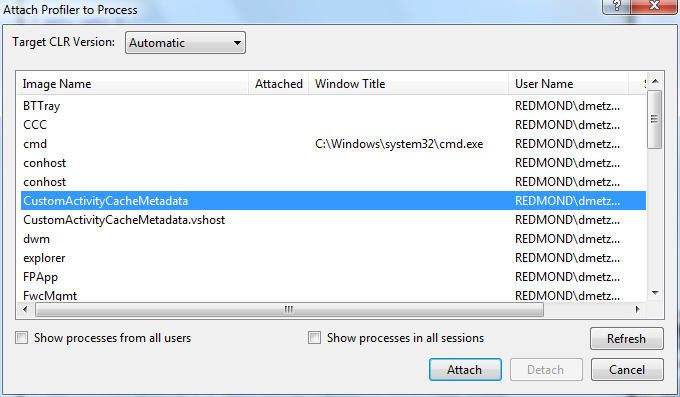
Be sure not to select the vshost process if you pressed Ctrl+F5. Select the process, click Attach, and when the profiling looks like it’s started hit enter in the command prompt window for the application. It will quit automatically when finished and that signals the profiler to stop automatically. You’ll get a summary screen similar to the following:
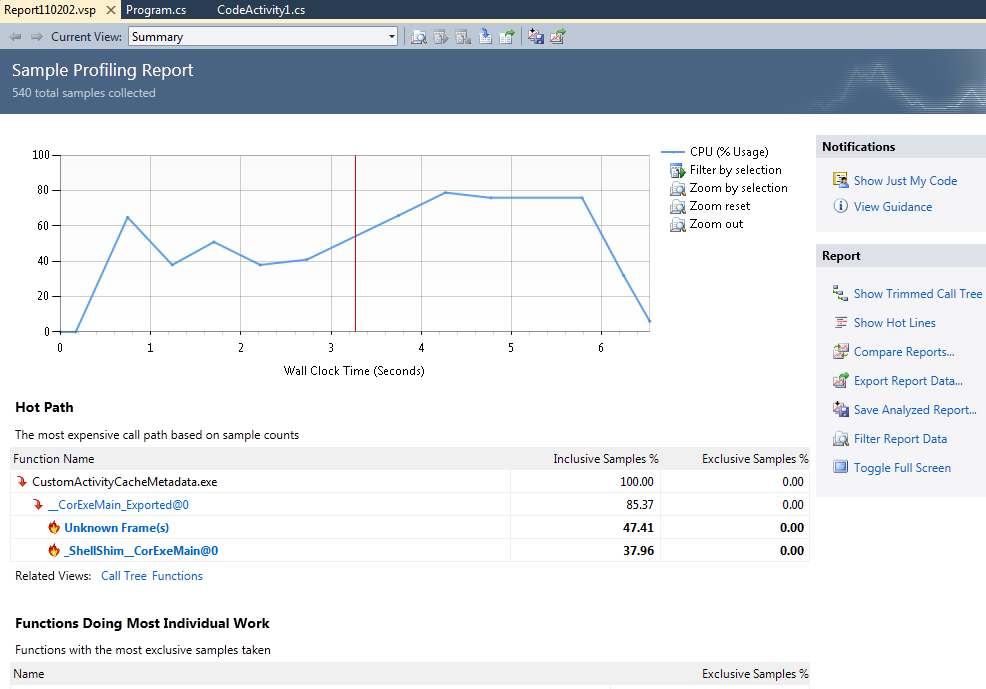
Note that you have to turn off the Just My Code feature. You also need to enable the Microsoft Public Symbol Store in the debugging symbols options.
Now, gather the profile for the comparison by uncommenting out the #define and following the same process as above. When that profile is collected, switch back to the baseline profile and click the Compare Reports button on the summary page. Find the comparison report in the file system. It will most likely be in the same directory as the base with the same name but an appended “(1)” on the filename. When you get the comparison summary page, change the comparison options to use the Inclusive Samples % column and set the threshold to 15 (or whatever it takes to kill most of the noise but still show the OnInternalCacheMetadata method).
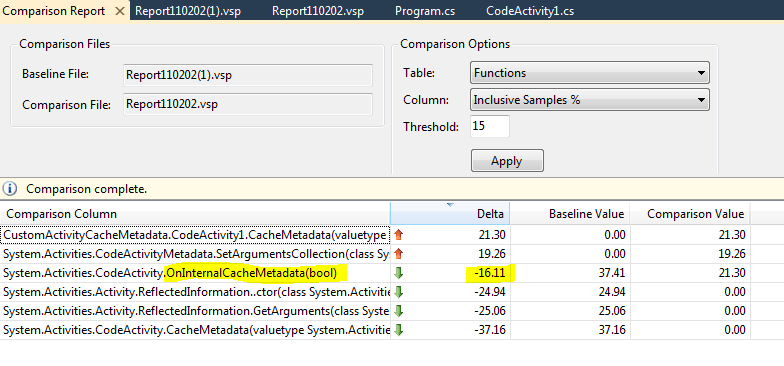
When an item in the comparison shows a baseline or comparison value of 0.00, it’s most likely because the code path is new, which is true in this case. What we care about are the code paths that are not new. In particular, OnInternalCacheMetadata is the key benefactor of the move to use a custom CacheMetadata method. The improvement shown here is 16%, not quite the 33% that we saw in the previous run. This can be because the improvements can sometimes spread across many methods. You should not expect the delta shown in profiling to completely match up with observed throughput.
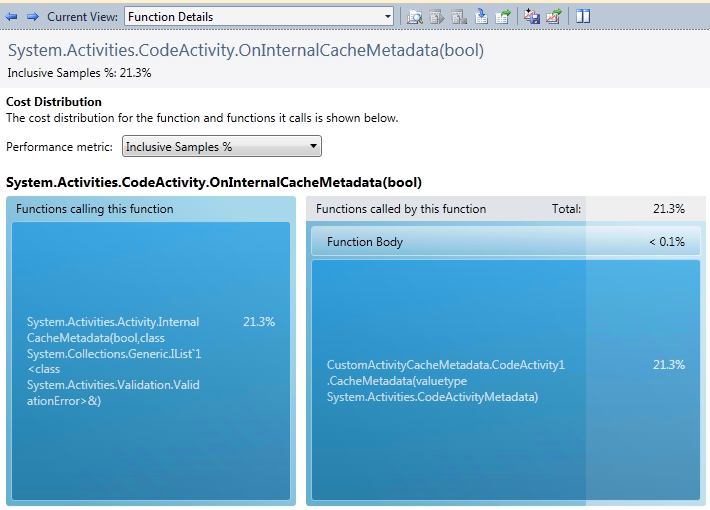
From the comparison report you can right-click on the method name and go to the function in the baseline and comparison reports. This will take you to the function view in those reports. By double-clicking the function name in the function view, you can see the Function Details view, which breaks down the costs for the method. In the baseline you can see that OnInternalCacheMetadata calls System.Activities.CodeActivity.CacheMetadata.

In the comparison file, the OnInternalCacheMetadata function is now calling the overridden CacheMetadata.
By drilling down into the baseline’s function view, you may notice the call from CodeActivity.CacheMetadata calls System.Activities.Activity.ReflectedInformation.GetArguments. This is obviously where we incur the performance cost for reflection.
The bottom line here is that if you’re in the business of writing custom activities, overriding CacheMetadata is a good thing. Most workflows will be bottlenecked at some other area like service calls or persistence so the real-world benefits are most likely going to be small.